RISK INTELLIGENCE / PROJECT 05
AV / CITY
Interrogate the evidence behind autonomy.
Explore a historical California autonomous-vehicle collision snapshot through geographic filters, source references, and explicit statistical qualifications.
30-SECOND EXECUTIVE BRIEF
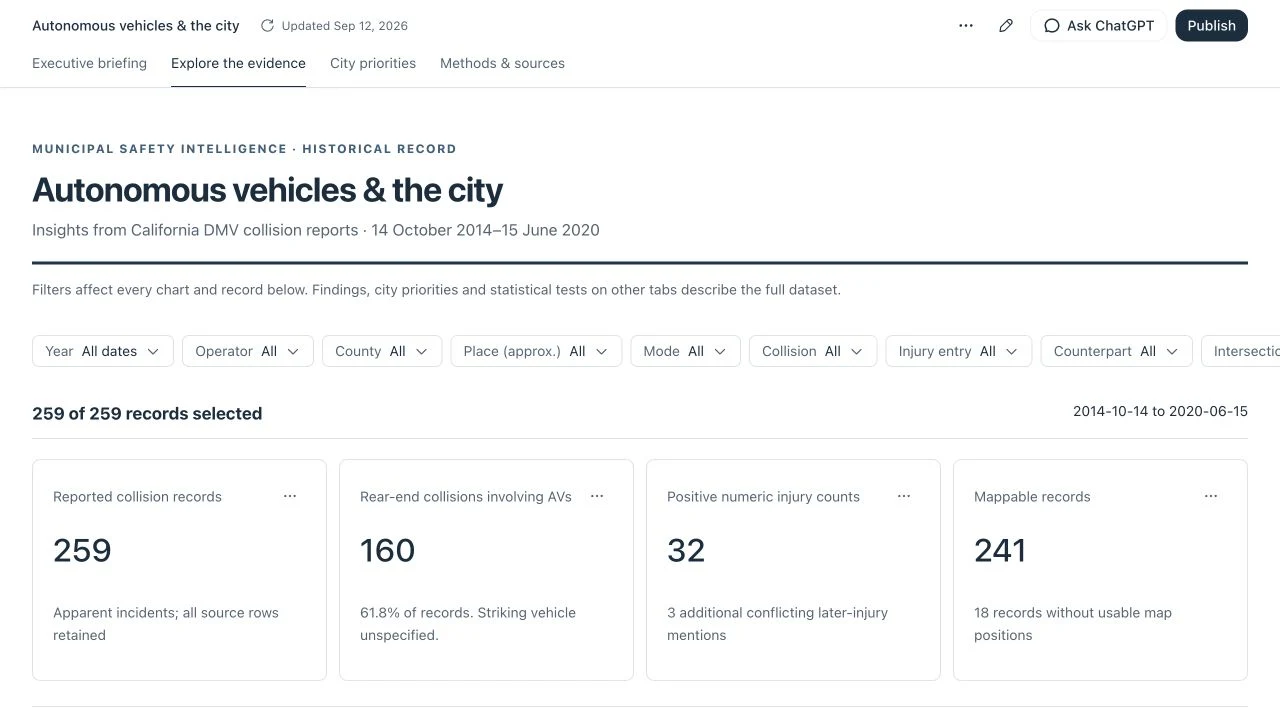
KEY TAKEAWAYS AT A GLANCEPresents 259 historical California autonomous-vehicle collision records (2014–2020) across 4 analytical workspaces, 9 interactive filter dimensions, SVG geographic maps, and record-level source locators.
Public autonomous-vehicle crash tallies are frequently misused to rank operators or claim causal risk without checking mileage-denominator compatibility, geocoding boundaries, or reporting bias.
Demonstrates rigorous risk-intelligence discipline: pairing exploratory data visualization with explicit statistical guardrails (Fisher exact tests, Wilson intervals, Holm adjustment, and denominator audits).
Analytical framing, exposure-denominator audit logic, geographic and injury-field qualification structure, and standalone zero-backend dashboard packaging.
01 / OVERVIEW
The idea in practice.
A self-contained analytical dashboard that brings a historical collision-record snapshot, geographic exploration, descriptive charts, and evidence qualifications into one browser experience.
02 / THE PROBLEM
A real systems question.
Collision counts are easy to overinterpret. Without compatible exposure data, consistent injury fields, and a clear account of geographic uncertainty, comparisons can imply safety conclusions the records cannot support.
03 / MY APPROACH
Make the reasoning inspectable.
Embed the snapshot and interface together, expose filtering and record-level source locators, and keep limitations alongside the results. Treat data interpretation as part of the product experience.
Portfolio contribution context: domain-led concept development and AI-assisted prototyping, as described by the owner. Individual implementation authorship is not documented in the supplied files.
04 / SYSTEM ARCHITECTURE
From inputs to insight.
Select any stage below to inspect its inputs, state transformations, outputs, and failure/uncertainty handling:
Autonomous Vehicle Crash Data/av-city-dashboard-upload/index.html259 reviewed collision records (14 Oct 2014 – 15 Jun 2020) with documentary references and workbook row/range locators
Separates 241 map-eligible records (including 148 in San Francisco) from 18 geographically unmatched records
Self-contained chunked JSON data payload embedded directly inside the standalone 4.4 MB HTML export
Preserves the 18 unmatched records in tabular counts and audits rather than silently dropping or fabricating coordinates
Algorithms & Engineering Logic
Conditional Contingency Analysis & Holm Multiple-Testing Adjustment
Autonomous Vehicle Crash Data/av-city-dashboard-upload/index.html · docs/RIPPLE-AV-AUDIT.mdP(Characteristic | Reported Collision) with Wilson 95% CI, Fisher exact p-value, and Holm step-down correctionEvaluates descriptive associations within the reported collision set (e.g., collision counterpart or movement state conditional on a report being filed) while controlling family-wise type-I error across multiple exploratory comparisons.
Exposure-Denominator Compatibility Gate
Autonomous Vehicle Crash Data/av-city-dashboard-upload/index.htmlRate = Collisions / Miles is UNDEFINED unless Geographic_Scope(Collisions) ≡ Geographic_Scope(Miles) ∧ Mode_Definition matchesAudits why combining California DMV collision reports with annual disengagement mileage summaries without matching municipal boundaries, time windows, and conventional-mode exclusions produces invalid safety rankings.
Architectural Decisions & Engineering Trade-Offs
Single-file 4.4 MB embedded HTML/JS/data export vs. cloud database API
Guarantees permanent, zero-latency browser execution on any static host (including GoDaddy cPanel) with zero server maintenance or database credentials.
Larger initial iframe download (loaded lazily only when the visitor clicks Launch Demo) and a fixed historical snapshot (2014–2020).
Foregrounding methodological limitations alongside executive charts
Demonstrates genuine risk-assurance judgment: knowing what a dataset cannot prove is as important as visualizing what it contains.
Avoids sensational "safest operator" headlines in favor of defensible, audit-ready analysis.
Verification, Testing & Evidence Scope
259 historical records, 241 map-eligible records, 148 San Francisco records, 9 filter dimensions, 4 workspace tabs, and outbound reference domain allowlist.
Self-contained browser execution, zero embedded credentials or local file leaks, and faithful preservation of all statistical qualifications.
Does not independently recalculate the upstream workbook scripts (not supplied in folder) or provide post-2020 live collision feeds.
HANDS-ON EXPLORATION
Explore the interactive lab & working prototype.
Historical collision snapshot covering 2014–2020. Reported-collision associations are not crash-risk estimates or causal effects. Exposure-denominator compatibility is unproven; no live refresh or AI service is provided.
Evidence Qualification & Exposure-Denominator Audit Explorer
Explore how the dashboard structures statistical evidence before launching the full 4.4 MB standalone analytical workspace below. Select an analytical lens to see how geographic eligibility, injury-field reconciliation, and exposure-denominator limits are enforced.
What the Records Support
All 259 collision reports filed under California DMV autonomous vehicle reporting rules between 14 Oct 2014 and 15 Jun 2020. 18 records lack street-level coordinates suitable for municipal boundary assignment.
Why Rate Rankings Are Rejected
Raw report totals reflect fleet size, urban operating hours, and reporting rules—not per-mile crash risk.
05 / RESULTS & CAPABILITIES
What the project does.
- 259 embedded historical collision records, with geography eligibility clearly distinguished.
- Four tabs, nine filtering dimensions, and record-level inspection.
- Interactive maps, descriptive comparisons, and source references.
- Visible qualifications for injury-field conflicts, geography, and exposure denominators.
06 / ENGINEERING CHALLENGES
Where the hard questions are.
- Preventing record counts from being interpreted as collision rates.
- Exposing inconsistent fields and approximate geography.
- Keeping historical data freshness distinct from the dashboard export date.
Current boundaries
- The snapshot covers 14 October 2014 through 15 June 2020; the export date does not refresh the records.
- Statistical qualifications are documented, but this portfolio does not independently reproduce every statistic; the underlying workbooks and analysis scripts were not supplied.
- Associations are conditional on being a reported collision and cannot establish crash risk, causation, or operator safety rankings.
- AI handoff features belong to the original host environment and are unavailable in standalone hosting.
07 / FUTURE DEVELOPMENT
The next useful steps.
- 01Add a reproducible refresh and provenance pipeline.
- 02Validate exposure compatibility before introducing rate-based comparisons.
- 03Independently reproduce statistical outputs from the underlying snapshot.
08 / AI DEVELOPMENT TRANSPARENCY
Tools, judgment, and evidence.
The portfolio owner uses ChatGPT, Claude, and Google Antigravity for concept development, design, and prototyping. Project-specific records do not establish which tool or person authored individual components. No precise human/AI coding split is claimed.
The capabilities described here were checked against supplied source files. Model behavior, cached examples, historical data, and proposed features are identified separately.
Source evidence
Autonomous Vehicle Crash Data/av-city-dashboard-upload/index.htmlAutonomous Vehicle Crash Data/av-city-dashboard-upload/UPLOAD-INSTRUCTIONS.txt
Local source references for provenance; confidential materials are not distributed.
SYSTEMS STUDY
Connecting the whole industrial system.
THE NEXT CONVERSATION
Let’s work on
what comes next.
Technical programs. Systems assurance. Intelligent technology.
Complex problems with a practical purpose.